When a cloud server becomes slow and unresponsive, it is often necessary to first check if the CPU load is excessively high. If the CPU load is indeed high, the next step is to further investigate which processes are consuming a substantial amount of CPU resources.
To view the CPU load using the top command, simply log in remotely and enter top followed by pressing Enter.
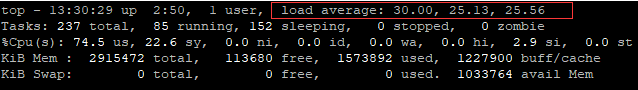
The key metric to observe is the load average, which is followed by three numbers representing the average CPU load over the past 1 minute, 5 minutes, and 15 minutes, respectively. Typically, the CPU load for a single-core should not exceed 4. For a quad-core CPU, the load should not surpass 16, which is four times the number of CPU cores. Exceeding these thresholds indicates that the load is high and abnormal.
Other parameters are explained as follows:
Upon discovering high CPU load, it is essential to further investigate which processes are consuming a large amount of CPU. The display results of the top command can assist in this examination.
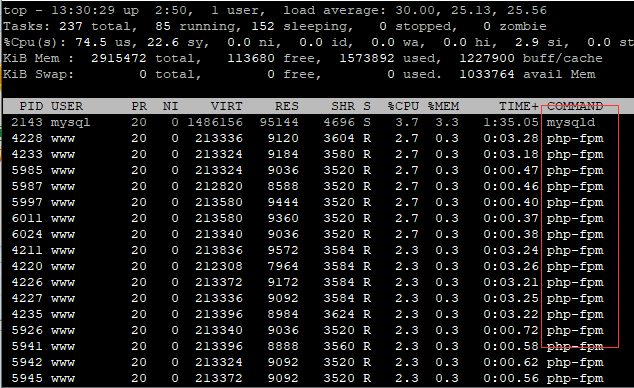
As illustrated, it is evident that processes like php-fpm are resource-intensive. php-fpm, mysql, httpd, nginx, and similar web processes of a site, when consuming a lot of resources, typically indicate high website traffic. In such cases, enabling website access logs for analysis is advisable. Generally, a larger access log implies greater resource consumption by the site. By opening and analyzing the logs, one can determine whether the high resource usage is due to naturally high traffic or abnormal access, such as excessive crawling by web spiders, anomalies in program connections, or being targeted by CC attacks.
23-02-2024 02:02:07
22-02-2024 03:19:32
22-02-2024 03:16:03
22-02-2024 03:14:03
22-02-2024 03:11:58
